

The situation
Growth exposed the work between the ERP and the decision.
Revenue was growing, but every increase in volume created more quoting, scheduling, and review work. The ERP held the transactions. What those records meant still depended on spreadsheets, follow-up conversations, and know-how held by a few experienced people.
Important decisions depended on a few people who knew which release was actually shippable, why margin had moved, or which tooling signal deserved attention. The goal was to keep those people in control while preserving each decision, override, and reason for the next review.
What the team did
They made the decision explicit before they made the app.
For production scheduling, the planner and operations team separated ERP status from the human Good, Maybe, or No call, tested that distinction against live releases, and kept ownership of every override. The backlog, charter, and 30/60/90 plan kept the build tied to real work.
The working record
Representative, sanitized example. No customer records shown.
01 · Prioritize
Choose the order, not just the backlog.
The team ranked work by operating value, effort, data readiness, and what a later tool could reuse. The sequence was the output.
Start now
01High value and ready to test
- Schedule updates
- Recurring ERP reports
Build next
02More judgment or data to map
- Tooling reorder
- Estimating and quoting
Extend later
03Builds on the first connections
- Capacity planning
- Daily management analytics
02 · Charter
Write down the decision before building the screen.
One selected use case was filled in with the people doing the job. The charter separated data the system could supply from judgment the team still needed to own.
Use-case charter
Production scheduling
Problem
- Each monthly ship commitment required repeated order-by-order checks.
- The ERP showed status. The planner still decided what was actually buildable.
Previous workaround
- One-at-a-time ERP lookups
- A working spreadsheet updated and redistributed by hand
People and decision
- The planner owns Good, Maybe, or No and the final monthly commitment.
- Operations helps resolve the exceptions behind a changed status.
Data
- Open orders, jobs, operations, inventory, and due dates
- Daily movement and assembly dependencies
Value and pilot plan
- Start with the current month's open releases.
- Prefill the status already known by the ERP.
- Surface the orders that still need a person.
- Keep the planner's override and final commitment.
Definition of useful
The planner reviews the exceptions, not every order.
03 · Build
Build against the real work.
01
Mock up
Sketch the current-month review before opening the platform.
02
Map
Separate ERP status from the planner's Good, Maybe, or No call.
03
Test
Run real releases beside the spreadsheet and capture what changes the commitment.
04
Release
Name the owner, override path, and next review.
04 · Continue
Friday was the handoff, not the finish.
Every tool left the week with an owner, a next check, and evidence the team would review after the presentation.
30
days
Use it in live work
Count the fallbacks. Fix the reliability gaps people actually hit.
60
days
Prove it holds
Check time saved, improve the rules, and train another person to change it.
90
days
Carry it forward
Extend the pattern to the next decision or adapt it at the next site.
What changed in the work
Separate workarounds became one operating loop.
The schedule set the daily commitment. Daily work fed the monthly review. Actual cost shaped the next margin decision. Because the tools shared source records and decision history, each step reused work from the one before it.
Planning
ERP releases became a schedule the team could stand behind.
An ERP release entered with its customer date, quantity, value, job, and inventory coverage. The planner marked it Good, Maybe, or No based on what was actually buildable. The allocation logic recalculated the projected ship month immediately, leaving the team with a shared commit instead of another private spreadsheet.
Illustrative synthetic data

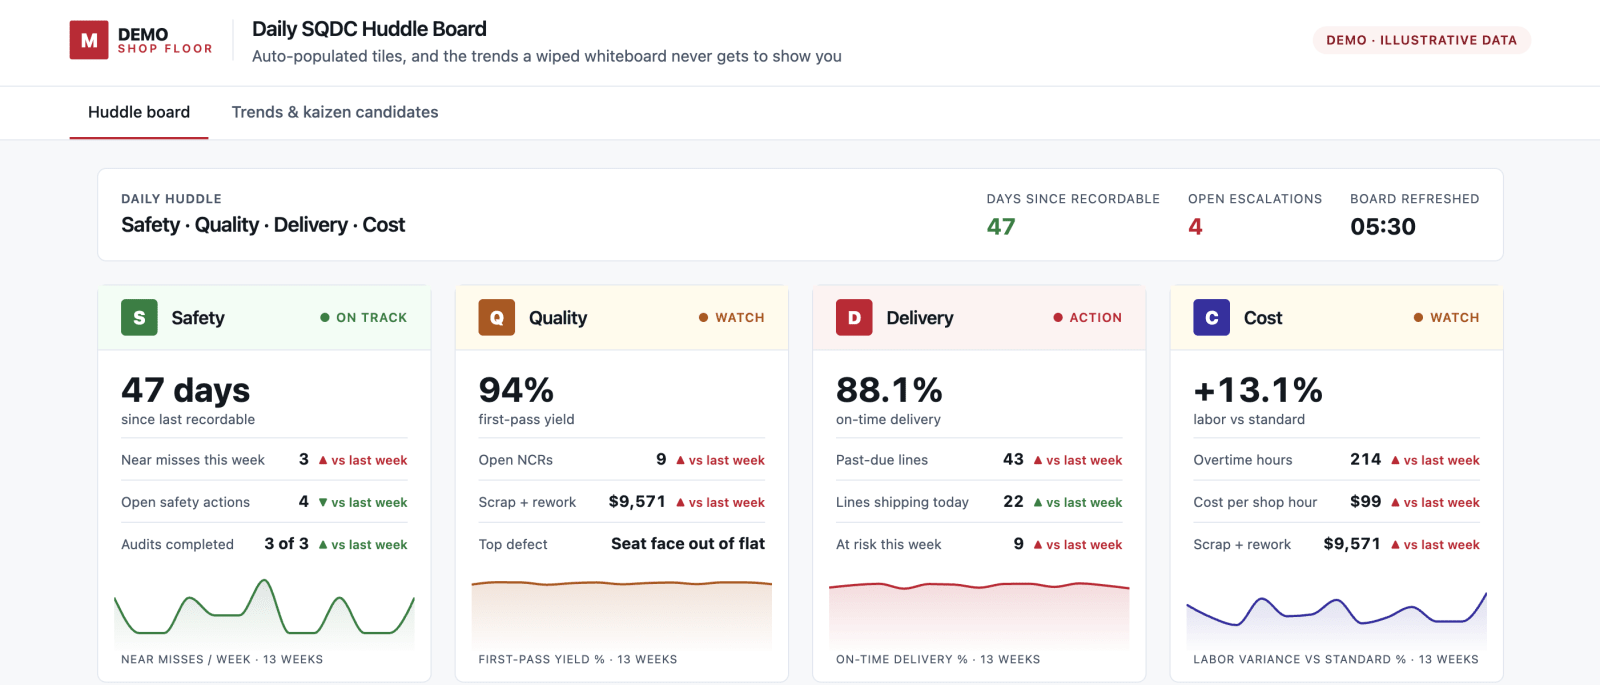
Daily management
The morning huddle carried trends, owners, and open actions forward.
The daily board joined safety, quality, delivery, and cost in one operating view. The team could see whether today was an isolated miss or part of a longer pattern.
Illustrative synthetic data
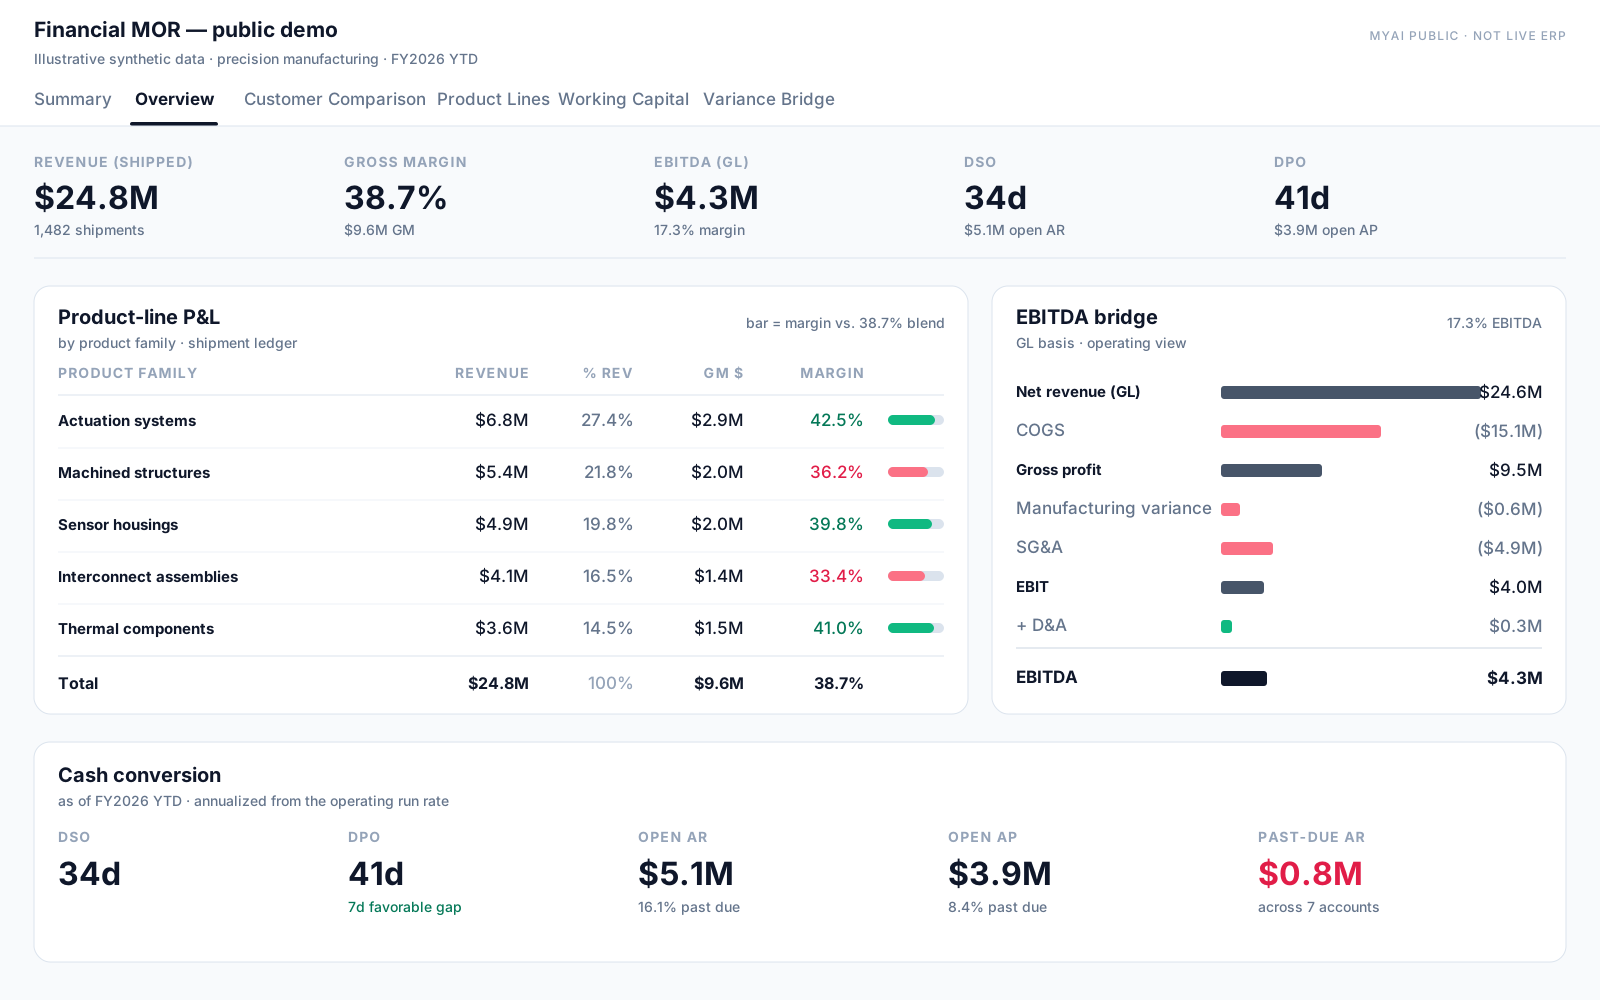
Monthly operating review
The operating view and the financial view finally reconciled.
The monthly review joined product-line performance, GL-based EBITDA, and cash conversion in one prepared surface. Leaders could see where an operating miss reached the P&L, then move from assembling numbers to deciding what to do.
Illustrative synthetic data
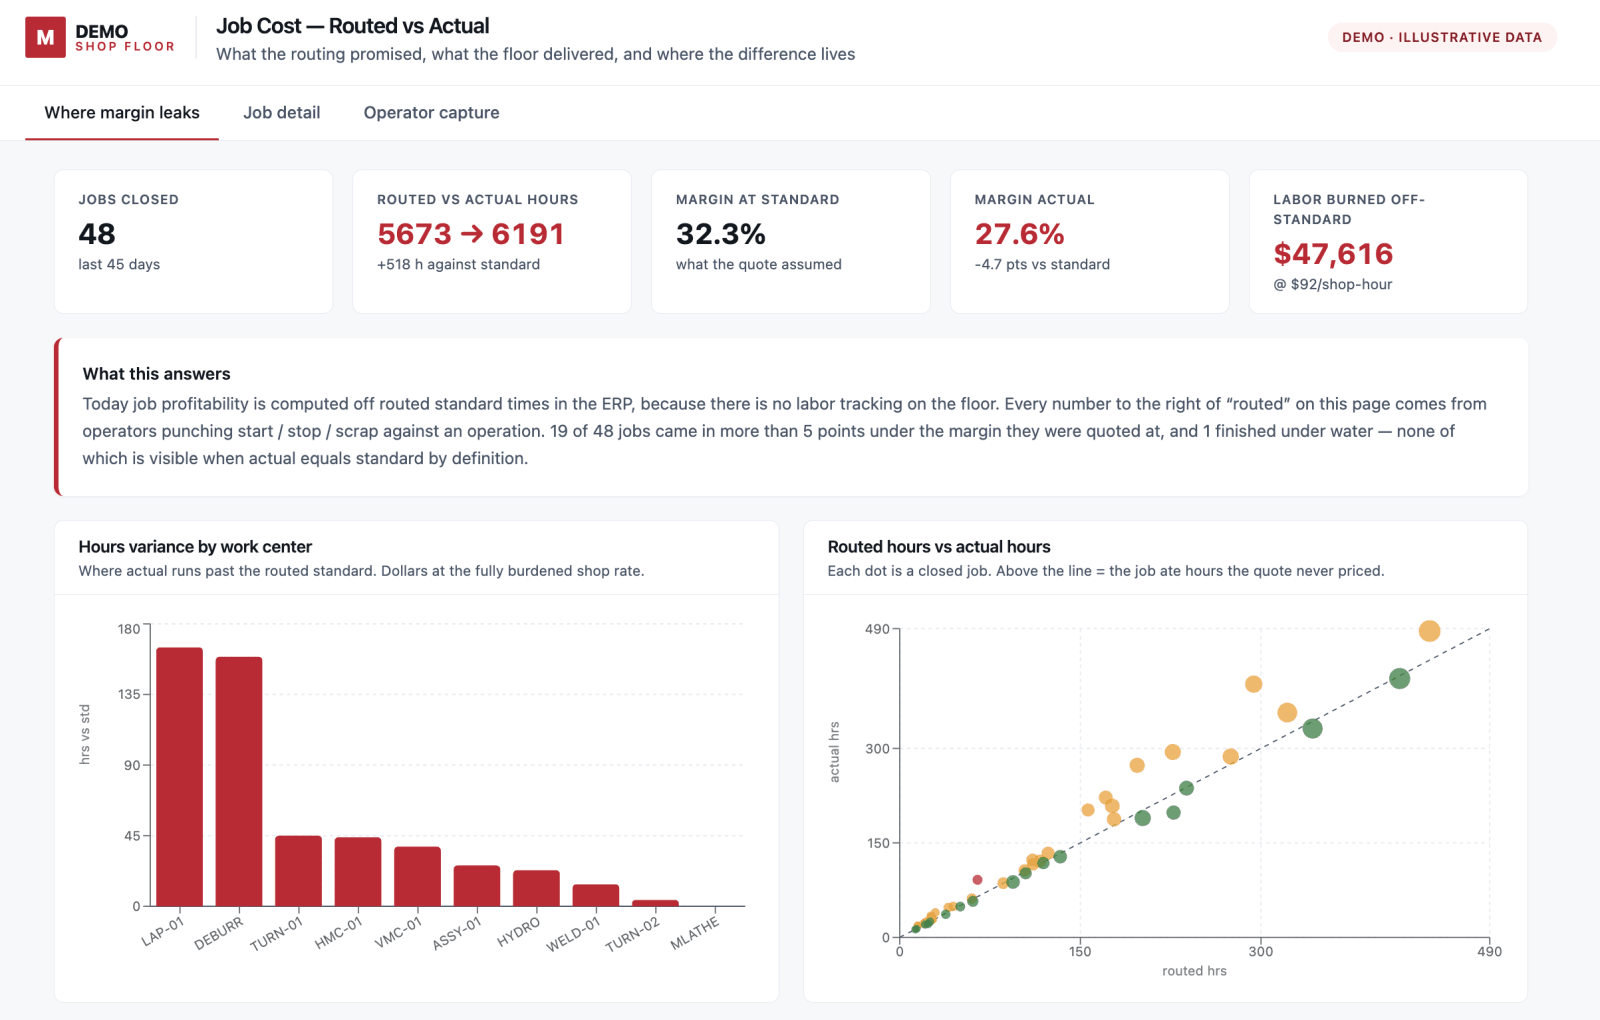
Margin analysis
Actual work improved the next operating decision.
Routed hours, actual hours, and job-level margin lived in the same view. Teams could see where the floor diverged from the standard and carry that evidence into the next quote and operating review.
Illustrative synthetic data
Results
The first returns were faster preparation and smaller review queues.
The tools cut repeated review work without removing the people who owned the decisions. At the first site, roughly 20 hours of weekly reporting work shifted into connected apps and agents.
8 hours
15 minutes
Monthly operating review preparation
Measured at the first site
2 days
2 hours
Shop-order release cycle
Reported by the second site
358 signals
4 to review
Tooling demand triage
Validated system output
The roughly 20 hours of weekly reporting is the first site's own estimate, not a measured result. Growth and EBITDA impact remain outcomes being enabled, not measured results presented in this story.
How it compounds
One expert's judgment stayed in the system. The next team started with it.
myai kept the source records, planner's call, overrides, and reasons connected to the scheduling tool. Other apps and people could reuse that context. Customer builders then carried the working pattern into a second site and adapted it with the local team.
From one person to a working network
Representative, anonymized sequence
- 01
01 · One expert
Judgment enters the system.
A planner explains why an order that looks ready may still miss the month.
- 02
02 · Shared context
The decision stays with the record.
myai keeps the ERP status, planner's call, override, and reason together.
- 03
03 · Connected work
Other tools reuse what the team learned.
Operations resolves exceptions. Finance and estimating work from the same decision history.
- 04
04 · Customer builders
The people closest to the work can change it.
The people who shaped the tools learn to change them and coach the next team.
- 05
05 · The next site
The next team starts ahead.
It reuses mapped records and proven parts, then adapts what is local.
What the customer kept
The records, decisions, software, and builders stayed connected.
Connected records
The ERP fields and working data already mapped to the decision.
Decision history
The exceptions, overrides, and reasons stay attached to the records for the next review.
Reusable software
Apps, components, and workflows the next team can inspect and adapt.
People who can build
Site experts who can change the tools and help another team begin.
How the transfer happened
Customer builders from the first site joined a focused build week at the second.
They brought mapped source fields, working app patterns, and a shared way to separate system status from human judgment. The local team adapted the tools, presented what it had built, and kept ownership of the next changes. The first site could then reuse what the second team improved.